|
FINANCIAL MANAGEMENT
CHECK POINT 45: FINANCIAL PERFORMANCE EVALUATION
Please Select Any Topic In Check Point 45 Below And Click. |
|
| |
|
DO I NEED TO KNOW THIS CHECK POINT?
|
|
1. THE PURPOSE OF THE FINANCIAL PERFORMANCE EVALUATION |
 |
|
THE PURPOSE OF THE FINANCIAL PERFORMANCE EVALUATION |
Business owners and financial managers must be familiar with the basic elements of financial performance evaluation, which represents one of the key management functions in every organization.
The timely preparation and availability of financial statements assists top management in the process of examining the condition and performance of a company. This process, known as Financial Performance Evaluation, serves to identify the company's strengths and weaknesses in terms of dollars and percentages.
The financial performance evaluation is designed to provide answers to a broad range of important questions, some of which are outlined below. |
ISSUES RELATED TO THE FINANCIAL PERFORMANCE EVALUATION |
No. |
Details |
1. |
Does the company have enough cash to meet all its obligations? |
2. |
Does the company generate sufficient volume of sales to justify recent investment? |
3. |
Does the company collect outstanding accounts from customers without creating a burden on its cash flow? |
4. |
Does the company make timely payments to suppliers to take advantage of discounts? |
5. |
Does the company utilize the inventory in an efficient manner? |
6. |
Does the company have sufficient working capital? |
7. |
Does the company maintain an adequate profit margin? |
8. |
Does the company produce sufficient return on investment? |
|
| |
FINANCIAL PERFORMANCE VARIABLES |
All of the above mentioned and other conditions must be met to ensure effective organizational performance and an acceptable level of return on the shareholders' investment.
To determine whether such conditions are met, management must evaluate the company's performance on a regular basis, e.g. once every three, six, or twelve months, and analyze results in terms of three Financial Performance Variables illustrated below. |
THREE FINANCIAL PERFORMANCE VARIABLES |
 |
|
|
|
|
Predetermined
Standards |
|
Past
Performance |
|
Acceptable Norms
Within An Industry |
| The company's performance must be measured against its own current financial budgets to determine the progress towards meeting current financial objectives. |
|
The company's performance must be measured against its past performance to establish the trends developed over the recent business period. |
|
The company's performance must be measured against the acceptable norms within its industry to determine the level of the company's competitiveness in the marketplace. |
|
|
| |
| Financial statements can be prepared manually or by using a specific Accounting Software Program as discussed in detail in Tutorial 3. |
| |
| THREE MOST POPULAR ACCOUNTING SOFTWARE PROGRAMS |
| |
| There are several excellent accounting software programs available to small business owners at present. According to TopTenReviews.com, three most popular accounting software packages are: |
| |
1. Sage 50 Complete Accounting 2013.
2. QuickBooks Pro 2011.
3. Bookkeeper 2012. |
|
|
|
2. EXAMINATION OF TRENDS |
|
|
IMPORTANCE OF THE FINANCIAL PERFORMANCE EVALUATION |
Evaluation of the company's performance in terms of Predetermined Standards provides the most significant management information and helps in the decision-making process.
Such an evaluation entails comparison of current or most recent results achieved by the organization with corresponding financial plans. Hence, it is necessary to have a set of well-defined plans to ensure sound evaluation of the company's financial performance. |
EXAMINATION OF TRENDS |
Comparison of the company's current or most recent results with the corresponding results of previous years is particularly useful in identifying Trends. Examination of trends helps management to develop an "early warning system" and provides tangible signs of potential problems in various areas of company activities.
An effective evaluation of the company's performance also entails comparison of financial results attained by the organization with the corresponding results acceptable in a particular industry. Such a comparison is usually accomplished by means of special ratios, known as Financial Ratios. These ratios are frequently used not only by managers, but also by investors, creditors, and various financial institutions. |
|
|
|
3. ELEMENTS OF THE FINANCIAL PERFORMANCE EVALUATION |
|
|
FINANCIAL PERFORMANCE EVALUATION |
Financial Performance Evaluation represents an important managerial responsibility and comprises three elements illustrated below. |
THREE ELEMENTS OF THE FINANCIAL PERFORMANCE EVALUATION
|
|
|
|
|
Current
Financial Analysis |
|
Comparative
Financial Analysis |
|
Financial Ratio
Analysis |
|
| |
|
|
4. CURRENT FINANCIAL ANALYSIS |
|
|
PURPOSE OF CURRENT FINANCIAL ANALYSIS
The prime purpose of Current Financial Analysis is to evaluate the most recent financial condition and operating results achieved by the company.
The central question addressed during current financial analysis is:
"Where is the company now in terms of dollars and percentages?"
Current financial analysis entails a comprehensive examination of the company's latest available financial statements illustrated below.
ELEMENTS OF CURRENT FINANCIAL ANALYSIS |
|
|
|
|
|
Latest
Balance
Sheet |
|
Latest
Income
Statement |
|
Latest
Statement
Of Cash Flows |
|
| |
|
|
5. EXAMINATION OF THE BALANCE SHEET |
|
|
EXAMINATION OF THE BALANCE SHEET |
Examination of the latest Balance Sheet enables management to achieve the first objective of current financial analysis - to measure the company's most recent financial condition.
This results in a detailed evaluation of assets, liabilities, working capital, (i.e. the difference between current assets and current liabilities), and shareholders’ equity.
Note:
Please examine your company’s most recent balance sheet and identify all items related to assets, liabilities and shareholders’ equity. If necessary, ask your CPA to prepare an updated balance sheet for your company. You may obtain additional information about a typical Balance Sheet in Tutorial 3. |
|
|
|
6. EXAMINATION OF THE INCOME STATEMENT |
|
|
EXAMINATION OF THE INCOME STATEMENT |
Examination of the latest Income Statement helps management to achieve the second objective of current financial analysis - to measure the company's most recent operating performance.
This leads to a comprehensive evaluation of revenues and expenses and the determination of cost of goods sold, gross margin from sales, and net income.
Note:
Please examine your company’s most recent income statement and identify all items related to revenue, expenses, and income. If necessary, ask your CPA to prepare an updated income statement for your company. You may obtain additional information about a typical Income Statement in Tutorial 3. |
|
|
|
7. EXAMINATION OF THE CASH FLOW STATEMENT |
|
|
EXAMINATION OF THE CASH FLOW STATEMENT |
Examination of the latest Statement Of Cash Flows enables management to achieve the third objective of current financial analysis - to measure the flow of incoming and outgoing funds.
Such an examination indicates whether the company is generating a positive cash flow, i.e. incoming funds exceed outgoing funds, or, conversely, a negative cash flow as a result of its operating, investing, and financing activities.
Note:
Please examine your company’s most recent cash flow statement and identify all items related to the movement of funds as a result of all operating, investing, and financing activities of the organization. If necessary, ask your CPA to prepare an updated cash flow statement for your company. You may obtain additional information about a typical Cash Flow Statement in Tutorial 3. |
|
|
|
8. COMPARATIVE FINANCIAL ANALYSIS |
|
|
PURPOSE OF COMPARATIVE FINANCIAL ANALYSIS |
The prime purpose of Comparative Financial Analysis is to evaluate the trends in the company’s financial condition and operating results during the last three fiscal years.
The central question addressed during comparative financial analysis is:
"What are the trends developed by the company in terms of dollars and percentages?"
Comparative financial analysis entails comprehensive examination of the company's financial statements covering three preceding fiscal periods as illustrated below. |
ELEMENTS OF COMPARATIVE FINANCIAL ANALYSIS |
|
|
|
|
|
Comparative
Balance
Sheet |
|
Comparative
Income
Statement |
|
Comparative
Statement
Of Cash Flows |
|
| |
Note:
Three fiscal years generally provide a sufficient period for establishing trends as a result of comparative financial analysis. However, management may select longer periods to complete comparative financial analysis. |
|
|
|
9. COMPARATIVE BALANCE SHEET |
|
|
COMPARATIVE BALANCE SHEET |
A Comparative Balance Sheet entails an examination of several balance sheets and it enables management to achieve the first objective of comparative financial analysis - to interpret changes in the company's financial condition during several fiscal years.
The comparative balance sheet, or Common-Size Balance Sheet, discussed in this program, will include three fiscal periods. Examination of three balance sheets will help management in a detailed evaluation of trends of assets, liabilities, working capital, and shareholders' equity during the last three fiscal years.
Note:
Please examine your company’s three most recent balance sheets and identify all items related to assets, liabilities and shareholders’ equity. If necessary, ask your CPA to prepare a comparative balance sheet for your company for the last three fiscal periods. You may obtain additional information about a typical Balance Sheet in Tutorial 3. |
|
|
|
10. COMPARATIVE INCOME STATEMENT |
|
|
COMPARATIVE INCOME STATEMENT |
A Comparative Income Statement entails an examination of several income statements and it enables management to achieve the second objective of comparative financial analysis - to interpret changes in the company's financial performance and results during several fiscal years.
The comparative income statement, discussed in this program, will include three fiscal periods. Examination of three income statements will help management in a detailed evaluation of trends of revenues, expenses, costs of goods sold, gross margins from sales, and net income during the last three fiscal years.
Note:
Please examine your company’s three most recent income statements and identify all items related to revenues, expenses, and income. If necessary, ask your CPA to prepare an comparative income statement for your company for the last three fiscal periods. You may obtain additional information about a typical Income Statement in Tutorial 3. |
|
|
|
11. COMPARATIVE STATEMENT OF CASH FLOWS |
|
|
COMPARATIVE STATEMENT OF CASH FLOWS |
A Comparative Statement Of Cash Flows entails an examination of several statements of cash flow and it enables management to achieve the third objective of comparative financial analysis - to interpret changes in the company's cash flows during several fiscal years.
The comparative statement of cash flows, discussed in this program, will include three fiscal periods. Examination of three statements of cash flow will help management in a detailed evaluation of trends of cash flows as a result of the company's operating, investing, and financing activities during the last three fiscal years.
Note:
Please examine your company’s three most recent cash flow statements and identify all items related to the movement of funds as a result of all operating, investing, and financing activities of the organization. If necessary, ask your CPA to prepare a comparative cash flow statement for your company for the last three fiscal periods. You may obtain additional information about a typical Cash Flow Statement in Tutorial 3. |
|
|
|
12. FINANCIAL RATIO ANALYSIS |
|
|
FINANCIAL RATIO ANALYSIS |
A Financial Ratio illustrates the relationship between two specific values extracted from an appropriate balance sheet or income statement.
Financial Ratio Analysis entails evaluation of the company's financial condition and operating results in terms of financial ratios and comparison of these ratios with the acceptable industry norms.
The central question addressed during financial ratio analysis is:
"How does the company's financial condition and operating performance compare with the industry norms?"
The main purpose of financial ratio analysis is to provide management and other parties with important information related to four essential parameters of the company's condition and performance illustrated below. |
FINANCIAL RATIO ANALYSIS
|
|
|
|
|
|
|
Company
Liquidity |
|
Company
Solvency |
|
Company
Profitability |
|
Company
Ability
To Manage
Assets |
|
| |
|
|
13. COMPANY LIQUIDITY |
|
|
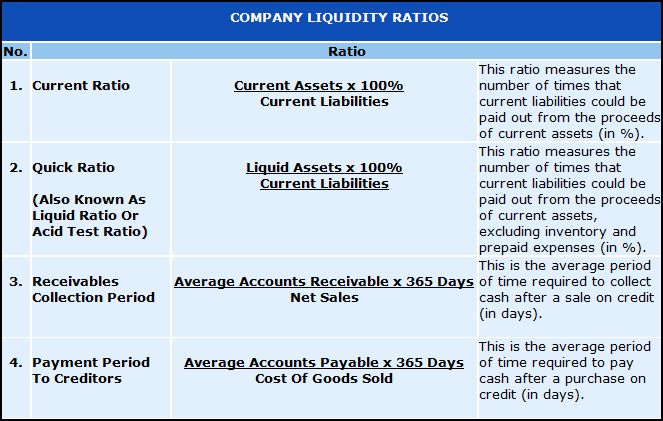
COMPANY LIQUIDITY |
Company Liquidity reflects its ability to meet current obligations upon their maturity by means of converting available assets and to pay current liabilities.
Evaluation of the company's liquidity entails computation and interpretation of the following financial ratios illustrated below. |
 |
|
|
|
14. COMPANY SOLVENCY |
|
|
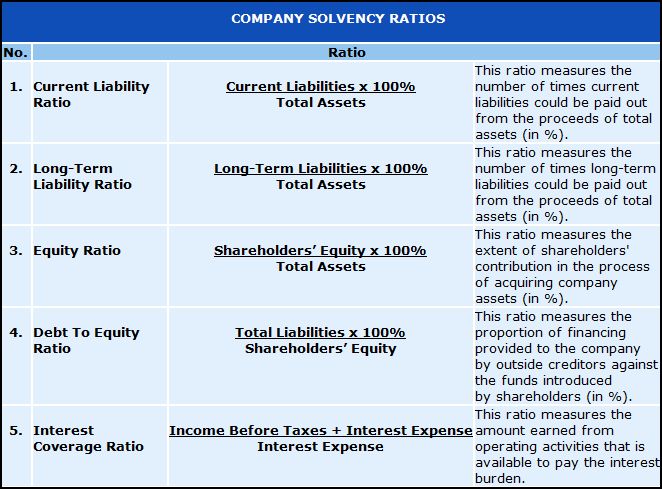
COMPANY SOLVENCY |
Company Solvency reflects its ability to meet all obligations and pay debts as they come due, whether such liabilities are current or long-term ones.
Evaluation of the company's solvency entails computation and interpretation of the following financial ratios illustrated below. |
 |
|
|
|
15. COMPANY PROFITABILITY |
|
|
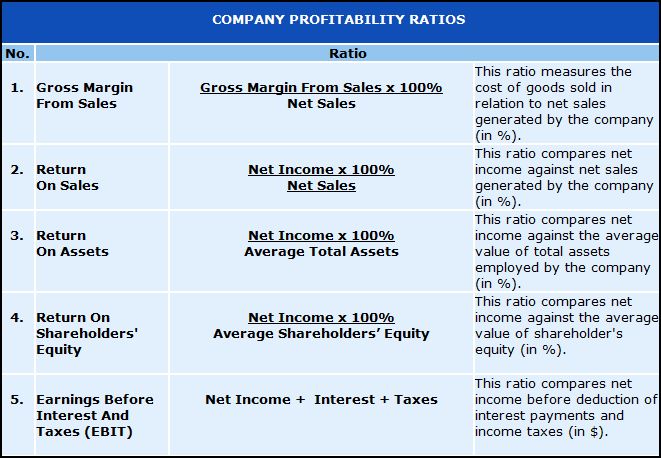
COMPANY PROFITABILITY |
Company Profitability reflects its ability to generate revenues, to produce a sizable net income, and to produce an acceptable return on investment.
Evaluation of the company's profitability entails computation and interpretation of the following financial ratios illustrated below. |
 |
Note:
Earnings Before Interest And Taxes (EBIT). A measure of a company's earning power from ongoing operations, EBIT excludes income and expenditure from unusual, non-recurring or discontinued activities. In the case of a company with minimal depreciation and amortization activities, EBIT is watched closely by creditors, since it represents the amount of cash that such a company will be able to use to pay off creditors. An indicator of a company's profitability, calculated as revenue minus expenses, excluding tax and interest. EBIT is also referred to as Operating Earnings, Operating Profit and Operating Income. Also known as Profit Before Interest And Taxes (PBIT), and equals net income with interest and taxes added back to it. |
|
|
|
16. COMPANY ABILITY TO MANAGE ASSETS |
|
|
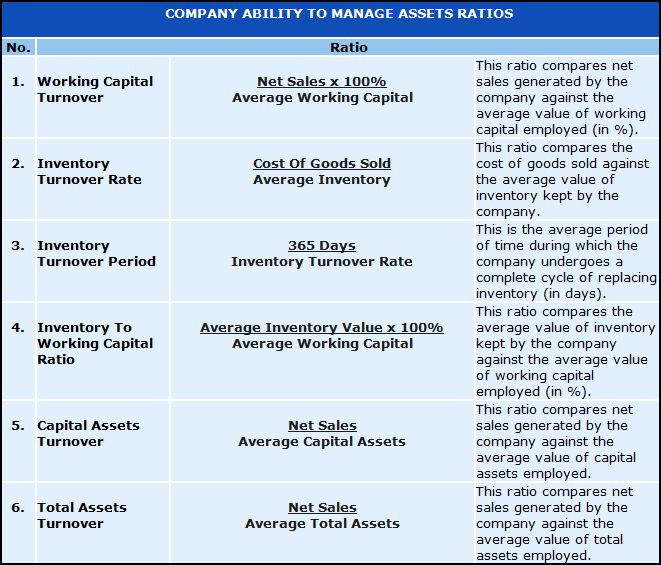
COMPANY ABILITY TO MANAGE ASSETS |
Company's Ability To Manage Assets reflects the degree of utilization of working capital, inventory, capital, and other assets in the process of generating funds during a specific accounting period.
Evaluation of the company's ability to manage assets entails computation and interpretation of the following financial ratios illustrated below. |
 |
|
|
|
17. FINANCIAL RATIO COMPARISON WITH THE INDUSTRY NORMS |
|
|
THE INDUSTRY AVERAGES |
As a result of financial ratio analysis, management can compare the company's condition and operating performance against an appropriate set of norms in a particular industry.
Such norms, or Industry Averages, can be obtained from various sources outlined below. |
|
SOURCES OF FINANCIAL AND OPERATING RATIOS |
No. |
Details |
1. |
Industry Financial Analysis Profiles.
Five-year comparative analysis includes income statements, balance sheets, and key financial ratios for more than 10,000 lines of business. Income statement analysis includes cost of sales, officer compensation, payroll, rent, taxes, interest, amortization and depreciation, advertising, employee benefits, and other selling, general, and administrative expenses in both dollars and as a percentage of sales. Available in all firms, small business, sole proprietor, and business start up versions. |
2. |
The Risk Management Association - RMA Annual Statement Studies.
Five-year comparative analysis includes income and expenses, balance sheets, and key industry ratios categorized by sales and assets size range for over 740 industries. Income and expense ratios include gross profit, operating expenses, officer compensation, and depreciation and amortization expense as a percentage of sales. |
3. |
Integra Financial Benchmarking.
Available in three-year and five-year versions which include income statements, balance sheets, and key business ratios by sales size range for over 900 industries. Five-year report includes cost of sales, officer compensation, employee benefits, advertising, bad debts, rent, depreciation, and other selling, general, and administrative expenses in both dollars and as a percentage of sales. |
4. |
Fintel Industry Metrics Reports.
Reports provide current income and expense and balance sheet comparisons in dollars and percentages and 16 key industry ratios, with data categorized by company size into small, medium, and large, and total industry breakouts. Available for over 900 industries. |
5. |
Financial Research Associates - Financial Studies of the Small Business.
Studies include income and expenses, balance sheets, and key industry ratios for small businesses generally capitalized at less than $1 million. Expense data includes labor, advertising, rent, insurance, officer compensation, depreciation, and interest as a percentage of sales. Data is categorized by company sales and asset size and covers approximately 70 industries. |
6. |
Almanac of Business & Industrial Financial Ratios.
Publication provides comparative benchmark data for 199 industry groups based on over 5 million IRS corporate tax returns. Data is categorized by asset size within an industry group, and includes income and expenses, balance sheets, and key business ratios. Expense detail includes cost of sales, salaries and wages, officer compensation, taxes, interest, amortization and depreciation, advertising, employee benefits, and other expenses as a percentage of sales. |
7. |
IRS Corporate Ratios.
Database provides ten years of corporate tax return data and financial ratios for over 250 industry groups. Information provided includes income and expenses, balance sheets, and key business ratios, with data categorized within an industry group by asset size. Data can be exported to Excel or other Excel-based valuation applications for additional analysis. |
|
|
|
|
18. FOR SERIOUS BUSINESS OWNERS ONLY |
|
|
ARE YOU SERIOUS ABOUT YOUR BUSINESS TODAY? |

Reprinted with permission. |
|
19. THE LATEST INFORMATION ONLINE |
|
|
|
| |
LESSON FOR TODAY:
Every Business, Just Like You , Needs An Annual "Physical” Check-Up! |
| |
|