MARKETING AND SALES MANAGEMENT
CHECK POINT 100: SALES PERFORMANCE EVALUATION AND CONTROL
This Check Point Is Available By Subscription Only,
But You Can Still Check Out The Menu Below. |
|
| |
|
DO I NEED TO KNOW THIS CHECK POINT?
|
| |
MARKETING AND SALES MANAGEMENT
CHECK POINT 100: SALES PERFORMANCE EVALUATION AND CONTROL
Please Select Any Topic In Check Point 100 Below And Click. |
|
| |
|
DO I NEED TO KNOW THIS CHECK POINT?
|
| |
WELCOME TO CHECK POINT 100 |
|
| |
HOW CAN YOU BENEFIT FROM CHECK POINT 100? |
| |
| The main purpose of this check point is to provide you and your management team with detailed information about Sales Performance Evaluation And Control and how to apply this information to maximize your company's performance. |
| |
| In this check point you will learn: |
| |
• About steps in sales performance planning, evaluation, and control process.
• About four types of sales performance analysis reports.
• About sales-by-a-sales person report evaluation.
• About sales-by-a-sales territory report evaluation.
• About sales-by-a-product line report evaluation.
• About sales-by-a-customer report evaluation.
• About marketing cost analysis.
• About allocation of marketing costs.
• About sales person's performance evaluation factors.
• About sales person's performance evaluation process... and much more. |
| |
LEAN MANAGEMENT GUIDELINES FOR CHECK POINT 100 |
| |
| You and your management team should become familiar with the basic Lean Management principles, guidelines, and tools provided in this program and apply them appropriately to the content of this check point. |
| |
| You and your team should adhere to basic lean management guidelines on a continuous basis: |
| |
| • |
Treat your customers as the most important part of your business. |
| • |
Provide your customers with the best possible value of products and services. |
| • |
Meet your customers' requirements with a positive energy on a timely basis. |
| • |
Provide your customers with consistent and reliable after-sales service. |
| • |
Treat your customers, employees, suppliers, and business associates with genuine respect. |
| • |
Identify your company's operational weaknesses, non-value-added activities, and waste. |
| • |
Implement the process of continuous improvements on organization-wide basis. |
| • |
Eliminate or minimize your company's non-value-added activities and waste. |
| • |
Streamline your company's operational processes and maximize overall flow efficiency. |
| • |
Reduce your company's operational costs in all areas of business activities. |
| • |
Maximize the quality at the source of all operational processes and activities. |
| • |
Ensure regular evaluation of your employees' performance and required level of knowledge.
|
| • |
Implement fair compensation of your employees based on their overall performance.
|
| • |
Motivate your partners and employees to adhere to high ethical standards of behavior. |
| • |
Maximize safety for your customers, employees, suppliers, and business associates. |
| • |
Provide opportunities for a continuous professional growth of partners and employees. |
| • |
Pay attention to "how" positive results are achieved and constantly try to improve them. |
| • |
Cultivate long-term relationships with your customers, suppliers, employees, and business associates. |
|
|
|
1.WHAT IS SALES PERFORMANCE EVALUATION? |
 |
|
SALES PERFORMANCE EVALUATION |
Business owners and sales managers must be fully familiar with sales performance evaluation and control procedures to ensure effective monitoring of sales results, and successful performance of the organization.
Sales Performance Evaluation is essentially a comparison between projected sales objectives and actual sales results achieved by the company.
The sales manager can plan Sales Objectives on several basis as illustrated below. |
BASIS FOR ESTABLISHING SALES OBJECTIVES |
 |
|
|
|
|
|
|
Sales
By
A Sales Person |
|
Sales
By
Sales Territory |
|
Sales
By Product
Or Service Line |
|
Sales
By A Customer
Or Industry |
|
|
| |
ADDITIONAL INFORMATION ONLINE |
|
|
|
2. STEPS IN SALES FORCE PERFORMANCE EVALUATION |
|
|
SALES FORCE PERFORMANCE EVALUATION
Sales Objectives, or Sales Quotas, are set during the planning stage and facilitate effective sales performance control. This process of establishing Sales Quotas is discussed in detail in Tutorial 5.
In addition, Sales Performance Standards are set for each sales person, thus providing a yardstick for measuring individual results. The differences between Planned Objectives and Actual Results must be identified, and subsequent corrective action must be taken accordingly.
The Sales Performance Planning, Evaluation, And Control Process entails a number of steps outlined below. The first three steps relate to sales force performance planning (Steps 1 to 3), and the next four steps relate to sales force performance evaluation and control (Steps 4 to 8). |
THE SALES PERFORMANCE PLANNING, EVALUATION, AND CONTROL PROCESS |
Step 1: Set Goals And Objectives For The Sale Force.
Step 2: Develop A Plan For The Sales Department To Achieve Sales Goals.
Step 3: Set Performance Standards For Individual Sales People.
Step 4: Prepare Monthly Sales Reports. |
|
|
|
|
|
|
|
Sales
By
A Sales Person |
|
Sales
By
Sales Territory |
|
Sales
By Product
Or Service Line |
|
Sales
By A Customer
Or Industry |
|
|
|
|
|
|
|
|
Step 5: Analyze Sales Performance Results.
Step 6: Evaluate Performance Of Individual Sales People.
Step 7: Compare Actual Results With Planned Objectives And Determine The Variance.
Step 8: Take Corrective Actions And Adjust The Sales Planning Process Accordingly (Repeat The Process As Necessary Starting With Step 1). |
The first three steps have been discussed earlier in the context of Sales Force Management And Motivation, and they provide the basis for the sales force evaluation and control. Evaluation of sales performance is based on detailed Analysis Of Sales Revenues attained by the company during a particular operating period. |
THE PARETO LAW |
|
It is common, for example, to find that the bulk of business can be attributed to a small number of customers. This is known as the 80 - 20 Rule, or the Pareto Law, which is applicable to any area of activities.
In case of sales management, the Pareto Law may be interpreted in 80% - 20% split illustrated below. |
TYPICAL ILLUSTRATION OF 80% - 20% SPLIT IN SALES |
1. |
80% of sales revenues may be generated by 20% of customers, or products, or sales territories. |
2. |
80% of profits may be generated from sales to 20% of customers. |
3. |
80% of time may be wasted on 20% of customers. |
4. |
80% of losses may be attributed to 20% of customers. |
|
| |
DOES THE PARETO LAW WORK ALL THE TIME? |
The Pareto Law is, certainly, not always accurate, and serves merely as a general guideline. Thus, it is necessary to analyze the Sales Data, and to identify major sources of sales revenues, profits and "headaches". The idea, of course, is to focus on the 80% of positive sales contributors and try to eliminate the 20% of negative sales contributors. |
| |
ADDITIONAL INFORMATION ONLINE |
|
|
|
3. SALES PERFORMANCE ANALYSIS |
|
|
SALES PERFORMANCE ANALYSIS |
The first step in the Sales Performance Analysis entails condensation of individual Sales Progress Reports described earlier, and preparation of Summarized Sales Reports. Summarized sales reports provide monthly and year-to-date information based on the breakdown illustrated below. |
BASIS FOR SALES REPORTING |
|
|
|
|
|
|
|
Sales
By
A Sales Person |
|
Sales
By
Sales Territory |
|
Sales
By Product
Or Service Line |
|
Sales
By A Customer
Or Industry |
|
|
| |
ADDITIONAL INFORMATION ONLINE |
|
|
|
4. SMALL BUSINESS EXAMPLE
SALES-BY-A-SALES PERSON REPORT |
|
|
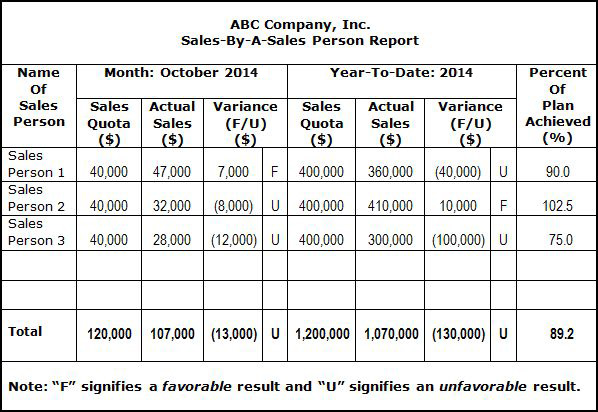
SALES-BY-A-SALES PERSON REPORT
A Sales-By-A-Sales Person Report enables the sales manager to monitor individual performance and examine results achieved by each sales person. This report, presented below, compares relevant sales volume quotas with appropriate monthly and year-to-date results produced by a sales person and determines variances accordingly. |
 |
| |
SALES-BY-A-SALES PERSON REPORT EVALUATION |
|
The examination of the above report indicates that:
- • Sales person 1 exceeded monthly sales quota by $7,000, though he or she is still behind on a year-to-date basis by $40,000.
- • Sales person 2 is $8,000 short of meeting the monthly sales quota. However, on a year- to- date basis, this sales person is still well ahead by $10,000.
- • Sales person 3 is behind by $12,000 and $100,000 respectively in meeting monthly and year- to-date sales quotas.
The final conclusion derived from this report is expressed in percentages of plan achieved by each sales person as follows:
- • Sales person 2 appears on the top of the list with 102.5%.
- • Sales person 1 is 10% (100-90) below the plan.
- • Sales person 3 is 25% (100-75) below the plan.
|
|
|
5. SMALL BUSINESS EXAMPLE
SALES-BY-A-SALES TERRITORY REPORT |
|
|
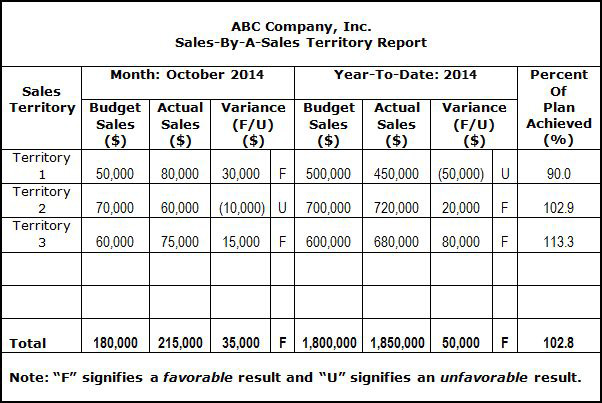
SALES-BY-A-SALES TERRITORY REPORT
A Sales-By-A-Sales-Territory Report provides information about sales revenues generated by different sales territories. This report, presented below, summarizes sales volumes per territory on a monthly and year-to-date basis and produces variances in a manner similar to the previous example. |
 |
| |
SALES-BY-A-SALES TERRITORY REPORT EVALUATION |
The examination of the above report indicates that:
- • Sales Territory 3 generates the best results by producing $15,000 and $80,000 in excess of the sales budget on a monthly and year-to-date basis, respectively.
- • Sales Territory 2 generates second-best results by producing an excess of $20,000 on a year-to-date basis despite the fact that monthly actual sales were short by $10,000.
- • Sales Territory 3 generates the worst results by being short of $50,000 on a year-to-date basis, although actual monthly sales exceeded the budget by $30,000.
The final conclusions are expressed in percentages of plan achieved by the company in each sales territory as follows:
- • Sales Territory 3 - 113.3%.
- • Sales Territory 2 - 102.9%.
- • Sales Territory 1 - 90%.
|
|
|
6. SMALL BUSINESS EXAMPLE
SALES-BY-A-PRODUCT LINE REPORT |
|
|
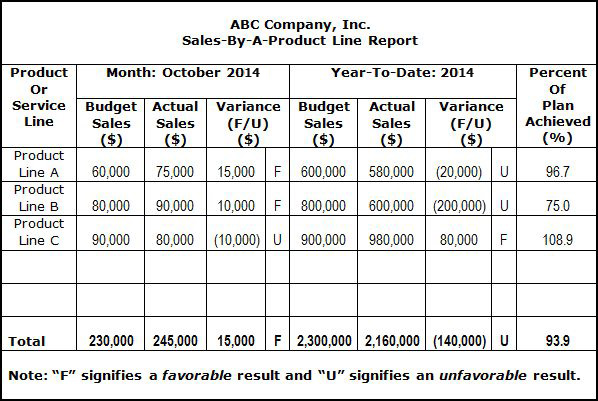
SALES-BY-A-PRODUCT LINE REPORT
A Sales-By-A-Product-Line Report provides information about sales revenues generated by different product or service lines. This report, presented below, summarizes sales volumes per product or service line on a monthly and year-to-date basis and computes variances in a manner similar to the previous examples. |
 |
| |
SALES-BY-A-PRODUCT LINE REPORT EVALUATION |
The examination of the above report indicates that:
- • Product Line C, the bestseller, achieved 108.9% of the plan with $80,000 excess in the year- to-date sales against the budget despite a $10,000 shortage in monthly sales.
- • The second-best performer is Product Line A. This line achieved 96.7%of the plan with a $20,000 shortage in the year-to-date sales, although monthly sales exceeded the budget by $15,000.
- • The worst performer is Product Line B at 75% of the plan achieved with a $200,000 shortage in the year-to-date sales. Its monthly sales, however, were $10,000 in excess of the budget.
|
|
|
7. SMALL BUSINESS EXAMPLE
SALES-BY-A-CUSTOMER REPORT |
|
|
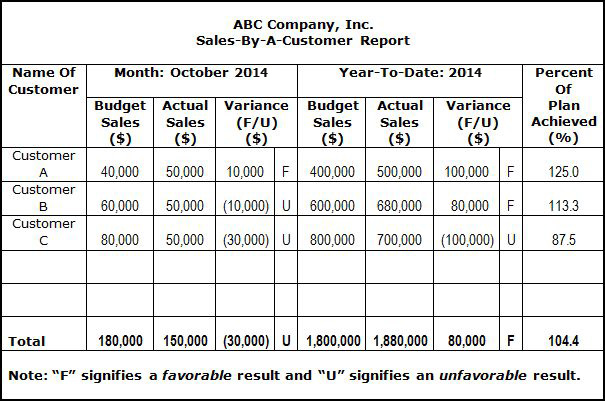
SALES-BY-A-CUSTOMER REPORT
A Sales-By-A-Customer Report provides information about sales revenues generated by individual customers or industries. This report, presented below, summarizes sales volumes per customer or industry on a monthly and year-to-date basis and produces variances similar to the previous examples. |
 |
| |
SALES-BY-A-CUSTOMER REPORT EVALUATION |
The examination of the above report indicates that:
- • Customer A is the best customer. This customer "achieved" 125% of the plan with $100,000 excess in the year-to-date sales against the budget.
- • Customer B appears to be second best with 113.3%of the plan achieved with $80,000 excess in the year-to-date sales against the budget.
- • The only poor results were derived from Customer C. Here the company achieved only 87.5% of the plan with $100,000 below the year-to-date sales budget.
|
| |
|
|
8. IMPORTANCE OF MONITORING SALES RESULTS |
|
|
MONITORING OF SALES RESULTS
Evaluation Of Monthly And Year-To-Date Results enables the sales manager to monitor and control the overall performance of the sales organization. Although monthly results reflect the most recent sales performance, special attention should be drawn to the year-to-date values. This is particularly important because year-to-date results may indicate favorable performance despite unfavorable monthly results or vice versa.
By evaluating performance results, the sales manager will be able to Identify Company Strengths And Weaknesses in relation to individual sales territories, product or service lines, customers, or industries. The subsequent comparison of actual results with the planned objectives and the determination of variances will enable the sales manager to Take Corrective Action and adjust the sales planning process. |
| |
ADDITIONAL INFORMATION ONLINE |
|
|
|
9. MARKETING COST ANALYSIS |
|
|
MARKETING COST ANALYSIS
Although Sales Volume Analysis provides useful information, it does not indicate the profitability of sales territories, products and services, or customer groups. The answer to this issue can be obtained by conducting a detailed Marketing Cost Analysis.
This analysis accounts for all relevant costs incurred during the planning and implementation stages of product and service promotion, distribution, selling, and after-sales service in the marketplace. One of the major problems with marketing cost analysis is the degree of accuracy in allocating various planning, promotional, distribution and selling costs to specific parameters presented below. |
ALLOCATION OF MARKETING COSTS |
|
|
|
|
|
Individual
Sales Territories |
|
Individual
Product Or Service Lines |
|
Individual
Customer Groups |
|
|
Despite its potential inaccuracy, marketing cost analysis may provide a useful guideline for determining the level of profitability of various products and services, and it may facilitate improved decision-making process for the entire management team. |
| |
ADDITIONAL INFORMATION ONLINE |
|
|
|
10. SALES PERSON'S PERFORMANCE EVALUATION |
|
|
EVALUATE EACH SALES PERSON'S PERFORMANCE
In addition to evaluating the company's sales efforts in the marketplace, it is essential to review the efforts of each sales person. Performance Evaluation by individual sales person entails examination of several factors illustrated below. (64) |
THE SALES PERSON'S PERFORMANCE EVALUATION |
|
Qualitative Factors
- • Knowledge:
- • Of the product or service.
- • Of the company and its policies.
- • Of competitors' products, prices, and strategies.
- • Of customers and their requirements.
- • Personal Selling Abilities:
- • Time management.
- • Planning of sales calls.
- • Quality of sales presentations.
- • Ability to handle objections and close sales.
- • Customer Relations:
- • Ability to understand customer requirements.
- • Ability to satisfy customer needs.
- • Personality.
- • Personal Appearance.
- • Health.
|
The actual evaluation of a sales person's performance entails several steps outlined below. |
THE SALES PERSON'S PERFORMANCE EVALUATION PROCESS
Step 1: Evaluate The Quantity Of The Sales Effort (The Input Factors).
These factors include such elements as number of calls per day, number of working days, selling time versus non-selling time, direct selling expenses, and indirect selling activities.
Step 2: Evaluate The Quantity Of The Sales Results (The Output Factors).
These factors include sales volume per product, customer, territory, or as a percentage of quota and market potential, and gross margin contribution by product, customer, or territory.
Step 3: Evaluate The Individual Sales Person's Qualitative Factors.
Some of these factors are the salesperson's knowledge about products and services, company, competitors and customers, personal selling abilities, customer relations, and personality. |
A thorough evaluation of the sales force performance and timely identification of problematic areas represent important sales management activities. These tasks enable the sales manager to monitor results produced by each sales person and to provide effective guidance on a continuous basis. |
ADDITIONAL INFORMATION ONLINE |
|
|
|
11. FOR SERIOUS BUSINESS OWNERS ONLY |
|
|
ARE YOU SERIOUS ABOUT YOUR BUSINESS TODAY? |
Reprinted with permission. |
|
12. THE LATEST INFORMATION ONLINE |
|
|
|
13. THE FINAL SURPRISE IN THE LEAN BUSINESS 2010 MANAGEMENT PROGRAM |
|
|
THE FUTURE OF KNOWLEDGE MANAGEMENT
Knowledge Management has never been more important than it is today! For this reason you and your management team should take your knowledge very seriously, if you really want to be successful in your business. |
Please watch these two final videos: |
|
| |
THE FINAL SURPRISE IN THE LEAN BUSINESS 2010 MANAGEMENT PROGRAM |
| Congratulations!!! You have just competed reading the last check point in the Lean Business 2100 Management Program. Hopefully, you found this program informative and now you are requested to do the following: |
| 1. |
Thank yourself for your wisdom and patience in studying this program.
|
| 2. |
Ask yourself: "Did I learn something new and useful?"
|
| 3. |
If the answer is "No" - please click here.
|
| 3. |
If the answer is "Yes" - please click here.
|
|
|
LESSON FOR TODAY:
To Get The Best Results, Motivate Your Sales
People To Do The Right Thing At The Right Time!
Joe Griffith
|
Click Here And Find Out How You Can Benefit From Lean Business Club. |
| |
|